
How to map commodity supply chains without losing supplier visibility
Mapping commodity supply chains starts with a practical question: where does supplier visibility disappear once a material leaves the first contract boundary? In bulk and industrial trade, that break usually happens when a commodity is blended, rebagged, transshipped, stored off-site, or handed to a local processor that changes its physical form without changing the commercial paperwork in an obvious way. A useful map has to preserve the link between the source material, the intermediaries, and the final delivery condition, otherwise the chart looks complete while the supply chain itself is already fragmented.
For commodity supply chains mapping, the first mistake is treating a supplier name as a fixed unit. A single listed supplier may be a miner, a trader, a broker, a toll processor, or a distributor depending on the lane and the contract structure. Visibility becomes weak when those roles are collapsed into one box. The map should separate origin, title transfer point, physical custody, processing site, and shipping point. Those are not the same thing, and in commodities they often sit in different countries.
Material characteristics matter because they shape how far visibility can travel. Iron ore, sulfur, fertiliser inputs, non-ferrous concentrates, grains, resins, and industrial chemicals all move differently. Bulk density, moisture tolerance, contamination risk, particle size, shelf life, and packaging format can change who touches the cargo and where records are created. A free-flowing dry bulk material may pass through a terminal in a way that leaves limited lot granularity. A sensitive chemical may require drum traceability, temperature limits, and hazard-class documentation. If the map ignores those handling conditions, the supplier network will appear cleaner than it is.
Transport mode is another source of hidden loss. Ocean freight often gives the broadest line-level view, but that visibility can weaken after discharge at a shared terminal or inland depot. Rail and barge movements may preserve chain-of-custody only at a route level, not at the individual lot level. Air freight can improve identification for urgent replenishment, yet it is usually a poor proxy for the commodity flows that matter most in heavy industry. In practice, the map should show where the shipment is identifiable as a unit and where it becomes aggregated with other stock.
Supplier visibility is also affected by transformation steps. Crushing, smelting, refining, drying, pelleting, blending, washing, grading, coating, and repackaging can all alter the product enough that the original source is less visible in downstream records. This is especially important when a commodity is used as an input to another industrial process. A map that ends at the first intermediary misses the point if the commodity later becomes a component, a formulation input, or a semi-finished material. The practical question is whether the transformation preserves enough batch identity to follow the material downstream without guesswork.
One of the most common misreads is assuming that a clean commercial invoice means a clean supply chain. In reality, trade documents can be precise on terms and still vague on physical origin. A shipment may show a trader of record while the underlying source sits several contractual layers away. Another common error is relying on the export country alone. That tells you where the cargo left, not necessarily where it was produced, mixed, processed, or re-exported. For commodities with heavy re-routing, the map needs both commercial origin and physical origin, even when they do not match.
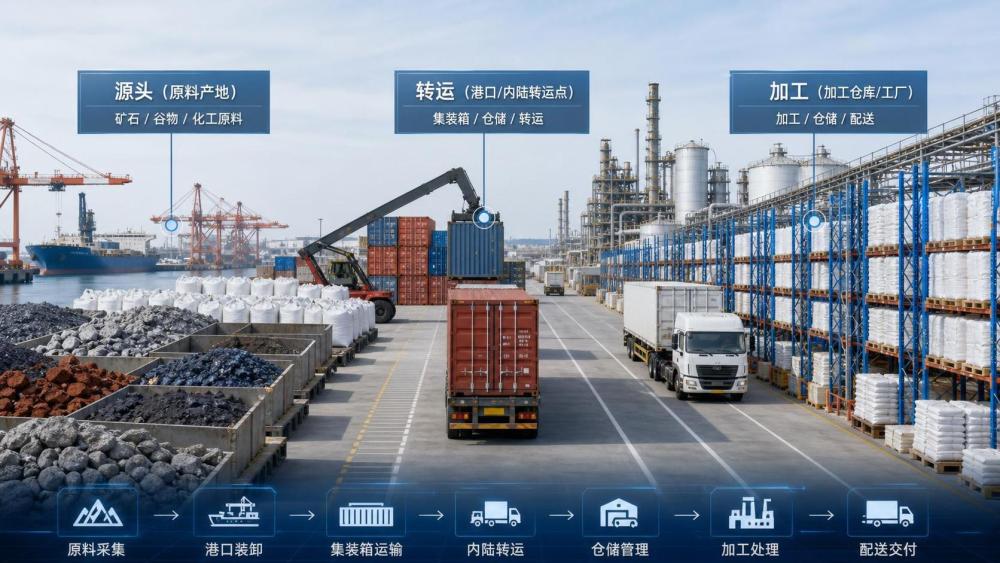
To keep supplier visibility intact, the mapping logic should hold three views at once: source nodes, movement nodes, and control nodes. Source nodes identify extraction, cultivation, or initial manufacture. Movement nodes show ports, inland depots, terminals, and transshipment points. Control nodes capture ownership change, quality inspection, customs release, warehousing, and contract handoff. When these layers are drawn separately, weak spots become visible. When they are blended into a single chain line, gaps disappear until a disruption exposes them.
Condition data matters as much as route data. Commodities often fail visibility checks because the map records where they went but not under what conditions they moved. Temperature-sensitive goods, moisture-sensitive powders, corrosion-prone metals, and contamination-sensitive feed inputs all need different handling logic. The absence of those conditions makes it difficult to tell whether a delay, a quality deviation, or a loss event came from transport stress, storage practice, or supplier behavior. The map should therefore carry the handling constraints alongside the route.
Procurement records, customs entries, bills of lading, warehouse receipts, quality certificates, and packing lists each contribute a different layer of clarity. None of them is sufficient alone. The useful discipline is reconciliation: matching lot IDs, container numbers, weight tolerances, packaging formats, and named facilities across documents. Where one document uses a trader name and another uses a terminal operator, the mismatch should be marked rather than harmonized away. That friction is often where visibility is lost.
Industrial commodities also require attention to substitution risk. Two suppliers may sell the same nominal grade but source from different basins, refineries, mills, or plantations, which changes impurity profiles, yield behavior, or downstream performance. A map that groups them only by product name can hide important exposure. In metals, small changes in sulfur, phosphorous, or moisture can matter. In agricultural inputs, varietal mix, storage age, and fumigation practice may alter usability. In polymers, melt flow or additive package can change production behavior. Supplier visibility is weak if the map does not retain those distinctions.
Geographic concentration is another layer worth drawing with restraint. A node should not be labeled as risky simply because it is in a known hotspot. What matters is whether the same port, the same inland corridor, the same terminal cluster, or the same processing zone serves multiple apparently separate suppliers. Shared infrastructure creates hidden correlation. If several suppliers depend on one storage corridor, one customs post, or one rail spur, the supply chain is less diversified than the supplier list suggests.
Data quality deserves the same treatment as physical quality. A supplier map built from inconsistent naming, duplicate records, or unlabeled intermediaries will produce false confidence. Normalizing company names is useful, but not if it strips away subsidiaries, site-level facilities, or broker roles that matter operationally. Better practice is to keep a hierarchy: entity, site, function, and shipment role. That structure is more cumbersome than a single flattened supplier list, yet it preserves the distinctions that matter when a lane tightens or a batch must be traced quickly.
Visibility can also be lost through over-aggregation. Many commodity maps group all volumes by month, country, or region because the data is easier to manage. That simplifies reporting but hides volatility inside the period. For materials that move in discrete lots, weekly or shipment-level granularity often reveals more about supplier dependency than a monthly total. Where data is incomplete, the map should show uncertainty instead of filling gaps with assumed continuity.
Trade route changes should be treated as structural, not incidental. A supplier visible through one port may become less visible after a reroute to a neighboring terminal, a different customs zone, or a new inland buffer stock. The physical lane can change while the commercial contract remains untouched. When this happens, the map has to be updated at the level of the actual movement path, not only the vendor list. Otherwise the supply chain looks stable on paper and unstable in practice.
For complex commodity supply chains, a strong map is less like a static diagram and more like a layered record of source, custody, processing, and movement constraints. That is what keeps supplier visibility intact when materials are blended, rerouted, repackaged, or handed across multiple operational boundaries. Without those layers, the map may still name suppliers, but it will no longer explain how supply really reaches the point of use.
Weekly Insights
Stay ahead with our curated technology reports delivered every Monday.
Recommended News
 Supply ChainOct 15, 2026How to choose a supply chain strategy for unpredictable demand
 Supply ChainOct 14, 2026How to assess an industrial equipment supplier's spare parts support
 Supply ChainOct 14, 2026EU Updates CSDDD Guidance on Global Supply Chain Due Diligence
 Global SourcingOct 13, 2026How to assess industrial automation suppliers for legacy integration