Cross-Border Logistics Management in Europe: Key Cost Traps
Why do logistics costs in Europe often rise after the freight quote looks settled?
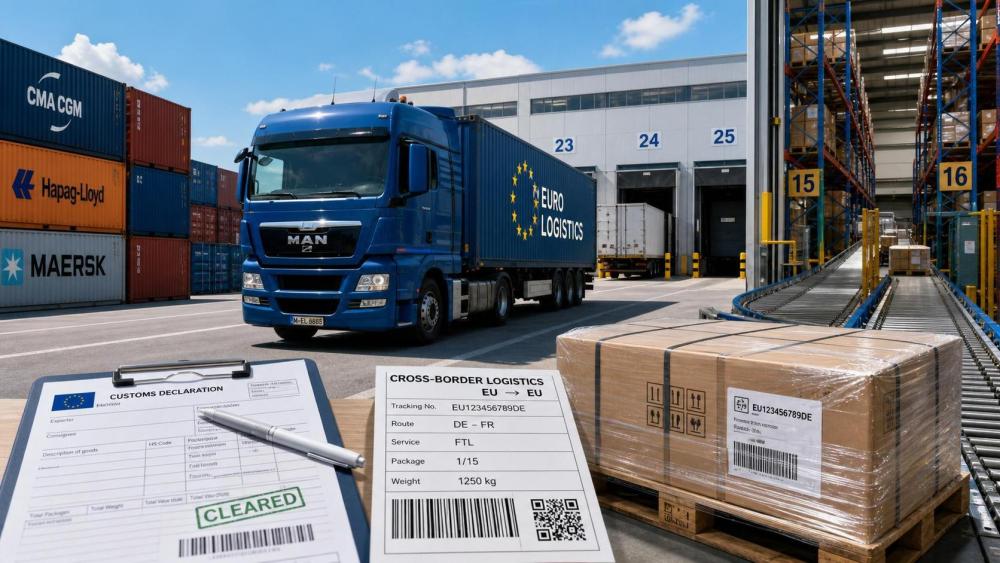
In cross-border logistics management Europe, the visible rate is rarely the full landed cost.
The bigger expense usually appears later, inside border handling, documentation errors, carrier handoffs, and delivery exceptions.
That is why a low headline quote can become an expensive routing decision within a few weeks.
European logistics adds complexity because each market has local operating practices, tax treatment details, labor constraints, and different last-mile structures.
A shipment moving smoothly through one corridor may become slow and costly in another, even inside the same region.
A practical way to read cross-border logistics management Europe is this: freight is only one line item, while reliability drives the rest.
When transit becomes unstable, costs spread into buffer stock, emergency transport, customer penalties, and internal rework.
This is where market intelligence matters.
Platforms such as GTIIN frame logistics decisions through trade data, compliance signals, carrier conditions, and sector-specific supply chain risk.
That broader view helps separate a cheap route from a durable route.
Which cost traps are missed most often in cross-border logistics management Europe?
The common mistake is to focus on base freight and ignore the small charges that accumulate across the journey.
In practice, the most damaging traps are usually operational rather than dramatic.
- Customs clearance delays that trigger storage, demurrage, or missed delivery windows.
- Fragmented carrier networks that require multiple subcontracted handovers.
- Incorrect commodity descriptions, HS codes, or origin records.
- Local surcharges for urban delivery, booking changes, liftgate use, or timed appointments.
- Returns, refused delivery, or re-consignment fees after address or label issues.
- Compliance gaps linked to VAT, CBAM exposure, packaging, or product-specific controls.
Needless cost also appears when lead-time assumptions are too optimistic.
If planning assumes a five-day flow, but real customs and terminal performance averages eight, inventory cost starts rising quietly.
The table below helps identify where hidden spend usually starts.
The point is not that every shipment carries all of these risks.
The point is that cross-border logistics management Europe becomes expensive when these variables are priced too late.
Are customs and compliance really bigger cost drivers than transport itself?
Often, yes.
For many industrial and multi-market shipments, customs quality determines whether transport cost stays stable or starts multiplying.
A lane can look efficient on paper, but a single classification dispute can erase the entire freight saving.
European cross-border flows also face a wider compliance agenda than basic import declarations.
Depending on the goods, the risk map may include VAT treatment, dual-use controls, packaging obligations, environmental reporting, and CBAM-related exposure.
This matters especially in sectors where technical specifications, origin evidence, or material composition are closely reviewed.
A useful discipline is to validate these five items before route selection:
- Commodity description aligns with the commercial invoice and product file.
- HS code logic has been checked against destination practice.
- Origin documentation supports duty and compliance claims.
- Importer responsibilities are contractually clear.
- Country-specific environmental or technical declarations are confirmed.
This is where GTIIN-style analysis becomes useful in a practical way.
By combining export trend monitoring with regulatory interpretation and corridor data, logistics decisions become less reactive.
That reduces the chance of paying for mistakes that were visible earlier.
What makes last-mile and multi-country carrier setups so hard to control?
The difficulty is not only distance.
It is the number of operational boundaries inside the journey.
Cross-border logistics management Europe often relies on line-haul providers, brokers, depots, local delivery partners, and customs agents working on different systems.
Every handoff adds timing risk and data loss risk.
More importantly, local last-mile rules vary sharply.
Urban zones may require pre-booked slots, smaller vehicles, emissions compliance, or special unloading arrangements.
If the original quote assumes a standard delivery profile, extra charges appear quickly.
A better question during procurement is not simply, “Can this carrier cover Europe?”
It is, “Where does this carrier control execution directly, and where does it outsource?”
That distinction affects damage rates, visibility, claims speed, and appointment performance.
When network design is unclear, service inconsistency becomes a recurring cost rather than a one-off issue.
How can route comparisons become more realistic before a contract is signed?
The cleanest method is to compare total corridor economics, not only freight rates.
That means testing each route against delay probability, documentation intensity, local delivery fit, and disruption recovery options.
In actual sourcing reviews, the strongest option is often not the cheapest quote.
It is the option with fewer volatile cost points.
A simple comparison framework helps.
This is also where external intelligence strengthens the buying process.
GTIIN’s focus on freight benchmarks, industrial sourcing, and supply chain resilience reflects the exact variables that distort route economics over time.
In other words, better comparisons come from combining price data with corridor behavior.
Which warning signs suggest a low-cost offer may become expensive later?
Some proposals look attractive because they leave the unstable parts unpriced.
That is common in cross-border logistics management Europe, especially across multi-country delivery networks.
- Transit times are quoted as fixed promises, but no lane-performance data is shared.
- Accessorial schedules are vague or incomplete.
- Customs support is described generally, without responsibility mapping.
- Claims handling and exception escalation are unclear.
- Subcontractor use is high, but control points are not visible.
- Sector-specific needs, such as packaging integrity or sensitive handling, are treated as standard cargo.
A disciplined review should test the offer against actual shipment history, not only presentation quality.
Ask where delays usually happen, what the average customs release time is, and which charges increased during the last disruption cycle.
If these answers stay vague, the savings may be temporary.
What is the smartest next step for lowering risk without slowing procurement?
Start by turning logistics evaluation into a lane-level cost review.
That means mapping each major European corridor by freight, customs exposure, local delivery complexity, and recovery options.
Then build a short decision checklist for every tender or routing change.
- Confirm all likely non-freight charges before comparing offers.
- Review compliance requirements by product and destination.
- Check who owns customs data quality and exception management.
- Validate direct network coverage versus subcontracted coverage.
- Measure total lead-time variability, not only average transit days.
Cross-border logistics management Europe rewards detail.
The largest savings often come from preventing small failures that repeat across lanes and quarters.
A more informed process, supported by market intelligence such as GTIIN’s trade and supply chain analysis, makes those patterns easier to spot early.
From there, the next move is straightforward: compare corridors on total cost, verify compliance before shipment, and use route data to challenge any quote that looks cheap for unclear reasons.
Weekly Insights
Stay ahead with our curated technology reports delivered every Monday.
Recommended News
 Supply ChainOct 15, 2026How to choose a supply chain strategy for unpredictable demand
 Supply ChainOct 14, 2026How to assess an industrial equipment supplier's spare parts support
 Supply ChainOct 14, 2026EU Updates CSDDD Guidance on Global Supply Chain Due Diligence
 Global SourcingOct 13, 2026How to assess industrial automation suppliers for legacy integration