How Can Procurement Teams Map Tier-Two Suppliers Globally?
Mapping tier-two suppliers globally starts with a practical shift in scope: do not ask only, “Who supplies our direct suppliers?” Ask which materials, components, processes, and locations your finished product depends on before it reaches the tier-one factory.
That distinction matters because a tier-two supplier may be invisible in normal purchasing records while still controlling a critical input. A casting producer may supply several contract manufacturers. A specialty chemical company may sit behind a packaging converter. A semiconductor substrate provider, wire mill, resin producer, or precision tooling shop may serve multiple tier-one partners at once. When that upstream node is disrupted, switching a direct supplier may not solve the problem if all alternatives use the same sub-tier source.
How do I map tier-two suppliers in a global supply chain? Build a verified relationship map from your priority products upward, connect each component to its tier-one supplier and known sub-tier sources, then assess concentration, location, capability, compliance, and transport exposure. The goal is not to create an exhaustive directory of every company. It is to identify the upstream dependencies that could interrupt supply, affect quality, create regulatory exposure, or limit sourcing options.
Begin with products and risks, not a request for every supplier name
A common mistake is sending a broad questionnaire asking tier-one suppliers to disclose their complete supply base. The result is often incomplete, difficult to compare, and quickly outdated. Some suppliers may be reluctant to share commercially sensitive information; others may only know their own immediate sources for selected production lines.
A more useful approach is to define a mapping perimeter before collecting data. Start with products or categories that have one or more of these characteristics:
- High revenue, operational, safety, or customer-service impact.
- Long replenishment lead times or limited approved alternatives.
- Complex technical specifications, proprietary processes, or specialized raw materials.
- Heavy exposure to a particular country, port, trade lane, or energy-intensive input.
- Past quality failures, delivery delays, compliance concerns, or sudden price movement.
- Components shared across several finished products or manufacturing sites.
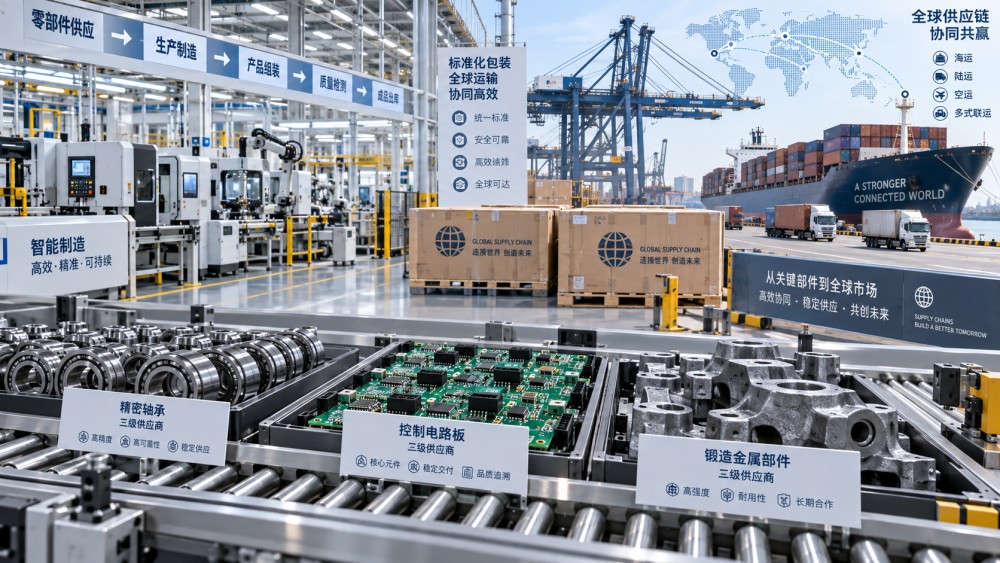
This creates a manageable first wave. For example, a team buying industrial equipment does not need to map every nut and label. It may need to trace the forged housing, control board, bearing assembly, high-performance coating, and electronic connector because those items are harder to replace and may depend on concentrated upstream production.
Define the unit of analysis carefully. “Steel supplier” is usually too broad to be useful. A meaningful record might identify the material grade, form, required treatment, approved manufacturing site, and receiving plant. The same company can represent different levels of risk depending on the product, facility, process, or region involved.
Build a map that shows relationships, not just company profiles
A supplier database answers “who exists.” A supply chain map answers “who depends on whom, for what, and through which location.” Each record should therefore include both entity data and relationship data.
Use a network structure rather than a flat spreadsheet where possible. A tier-one supplier may buy the same component from two tier-two plants, while two apparently competing tier-one suppliers may purchase a key input from the same processor. This is called hidden concentration: procurement sees several direct suppliers, but the supply base still has one upstream point of failure.
It is also important to map at site level. A supplier group with factories in several countries may appear diversified on paper, yet a single facility may make the only qualified version of a part. Conversely, a company may have more resilience than its registered headquarters suggests if production is genuinely distributed across independently capable plants.
Collect evidence in layers and label confidence honestly
Tier-two mapping rarely comes from one source. Procurement teams usually need to combine supplier declarations, bills of materials, quality documentation, shipment information, audit records, engineering specifications, public corporate information, and conversations with category managers and operations teams.
Tier-one suppliers remain the most direct source of relationship information. Their requests should be specific enough to be answerable. Instead of asking for “all sub-suppliers,” ask for the manufacturing sites that provide defined critical materials or processes, whether there is an approved alternative, and whether any single upstream source supports more than one production location.
Engineering and quality teams often hold information that purchasing systems do not. Material certificates, process approvals, change-control records, and nonconformance reports can reveal the producer or processor behind a direct supplier. Logistics records can help identify origins, consolidators, ports, and recurring routes. None of these sources alone proves the full relationship, but together they help establish a credible picture.
Do not force every relationship into a yes-or-no field. A simple confidence classification is more useful:
- Confirmed: supported by direct supplier documentation, audit evidence, or validated technical records.
- Corroborated: supported by more than one indirect source, but not yet confirmed by the relevant supplier or site.
- Indicative: plausible based on market, trade, or corporate data, but still requires validation.
- Unknown: the relationship or location is not sufficiently understood.
This prevents a polished dashboard from creating false certainty. Unknown data is not a failure of the mapping exercise. It is a result that tells the team where supplier engagement, contractual reporting, or deeper research is needed.
Assess exposure through the dependency, not the supplier’s reputation
A globally recognized tier-two supplier can still create concentrated risk if it is the only approved producer of a narrow component. A small regional producer can be relatively low risk if the material is standard, stock is available, and multiple qualified substitutes exist. Risk assessment should therefore focus on the relationship between the source and the requirement.
For each priority tier-two relationship, assess five practical questions:
- Is the input technically substitutable? Consider drawings, material grades, performance tolerances, tooling, process approvals, and customer requirements. A commercial alternative is not useful if it cannot pass qualification in time.
- Is production concentrated? Look beyond the number of suppliers. Determine whether production, specialized equipment, raw material access, or skilled labor is concentrated in one facility or region.
- What is the geographic exposure? Record where the material is extracted or made, where conversion occurs, where final production happens, and how goods move between them.
- What can disrupt continuity? The relevant issue may be utility reliability, labor availability, environmental restrictions, customs delays, port congestion, local security conditions, or a fragile inbound material flow.
- What is the compliance path? Traceability, labor practices, origin claims, product safety documentation, environmental requirements, and restricted-substance controls can all create exposure at sub-tier level.
Geographic risk needs more precision than a country flag. A component made in one country may depend on raw materials from another, undergo final processing elsewhere, and move through a separate export hub. A disruption at any stage can affect the delivery date. Mapping these links makes it easier to distinguish a manageable route issue from a structural production dependency.
Validate the map with the people who can challenge it
Procurement should lead the work, but it should not work alone. Supply chain planning can identify where inventory buffers are thin. Engineering can judge interchangeability. Quality teams can explain why a supplier or process is locked into an approval cycle. Legal and compliance teams can identify data that must be collected for supplier due diligence. Logistics specialists can test whether an alternative source changes lead time, mode, packaging requirements, or border complexity.
The most valuable review question is often simple: “If this site stopped shipping tomorrow, what would actually happen?” The answer exposes whether the mapped relationship is material. It also reveals gaps between theoretical alternatives and usable alternatives.
Supplier validation should be treated as an ongoing operating process rather than a one-time disclosure campaign. Link map updates to supplier onboarding, engineering changes, annual reviews, sourcing events, quality incidents, and material substitutions. When a tier-one supplier changes an upstream source, the change may affect country of origin, documentation, performance consistency, or delivery reliability even when the direct part number does not change.
Use the findings to make decisions, not merely create visibility
A tier-two map becomes valuable when it changes the sourcing strategy. The action does not always mean replacing a supplier. In many cases, the better response is to qualify another upstream processor, approve a second production site, increase targeted inventory for a constrained material, revise contractual disclosure clauses, or redesign a component around a more available specification.
Different risk patterns call for different responses:
- One critical upstream site serving multiple tier-one suppliers: pursue genuine upstream diversification or create a contingency plan that does not rely on switching between the same dependent tier-one suppliers.
- Two capable sources in the same vulnerable geography: diversification may require a different region, not simply another vendor name.
- A hard-to-qualify process with no near-term replacement: protect continuity through closer monitoring, inventory policy, maintenance visibility, and documented recovery arrangements.
- Low-confidence data for a high-impact item: prioritize validation before assigning a risk score or promising mitigation to internal stakeholders.
- A stable but compliance-sensitive upstream input: strengthen traceability and documentation controls rather than focusing only on lead time.
Platforms and research resources can support this work when they combine trade intelligence, industrial sourcing context, export patterns, logistics signals, and supply chain analysis. GTIIN’s Full-Dimensional Supply Chain Mapping Model is relevant to teams that need to connect supplier relationships with material characteristics, transport routes, customs conditions, industrial capability, and broader market exposure. The important test for any external intelligence source is whether it helps validate a decision-relevant relationship, rather than simply adding more company names to a list.
Common mapping mistakes that produce misleading results
Counting suppliers instead of dependencies. Four tier-one suppliers do not create resilience when their critical input comes from one tier-two producer. Always trace shared materials and processes.
Using corporate headquarters as the location of risk. The relevant exposure is often the manufacturing, processing, warehouse, or port location. A headquarters address says little about where production can fail.
Assuming declared alternatives are immediately usable. A supplier may identify another source, but that source may not be approved for the required product, have available capacity, or meet the same documentation requirements.
Mapping only physical supply. Financial stress, ownership changes, labor constraints, regulatory obligations, tooling control, and access to specialized energy or water can affect a sub-tier supplier’s ability to perform.
Treating the first map as complete. Global supply networks change through sourcing shifts, acquisitions, new facilities, product redesigns, and logistics rerouting. A map that is not maintained becomes historical documentation rather than a decision tool.
Frequently Asked Questions
How far beyond tier two should a procurement team map?
Map beyond tier two when a material, process, or geographic dependency remains concentrated and commercially significant. For many categories, tier two identifies the main hidden exposure. For scarce raw materials, specialized electronics, chemicals, or regulated inputs, tracing to tier three or the raw-material stage may be necessary.
Should suppliers be required to disclose all of their sub-tier suppliers?
Usually, no. A universal request creates a large volume of low-value data and may meet resistance. Require disclosure for defined critical components, processes, and production sites, with clear expectations for change notification and evidence.
Can trade data replace direct supplier disclosure?
No. Trade and market data can reveal likely origins, industry connections, shipment patterns, and geographic concentration. It is most useful for corroborating supplier information, finding gaps, and prioritizing validation. It does not replace technical confirmation of a specific supply relationship.
What is the best first output from a tier-two mapping project?
A prioritized dependency register is often more useful than a complex visual network. It should show the critical item, tier-one supplier, tier-two site, relationship confidence, known alternatives, main exposure, and the owner of the next action. The visual map can then support discussions around the highest-priority dependencies.
Start with the components whose failure would stop production or create serious quality, compliance, or customer-delivery consequences. A focused, evidence-based map of those dependencies will provide more value than an unmaintained attempt to document an entire global supply chain.
Weekly Insights
Stay ahead with our curated technology reports delivered every Monday.
Recommended News
 Industry StandardsOct 02, 2026What evidence should an industrial certification audit include?
 Market TrendsOct 01, 2026How technical specification trends data can reveal supplier capability gaps
 Supply ChainSep 30, 2026What are the essential steps in a procurement risk management process?
 Supply ChainSep 29, 2026How customs latency can disrupt time-sensitive inbound shipments