Trade Route Risk Analysis: How to Compare Safer Options
In global commerce, the shortest transit line rarely tells the full story. A practical trade route risk analysis looks beyond quoted freight rates and nominal lead times to compare how exposed each route is to disruption, delay, and unexpected cost escalation. That matters more now because geopolitical tension, uneven port performance, changing customs controls, and tighter compliance rules can turn a seemingly efficient route into a fragile one. For organizations balancing procurement timing, landed cost, and fulfillment certainty, safer options are usually the result of disciplined comparison rather than instinct.
What trade route risk analysis really measures
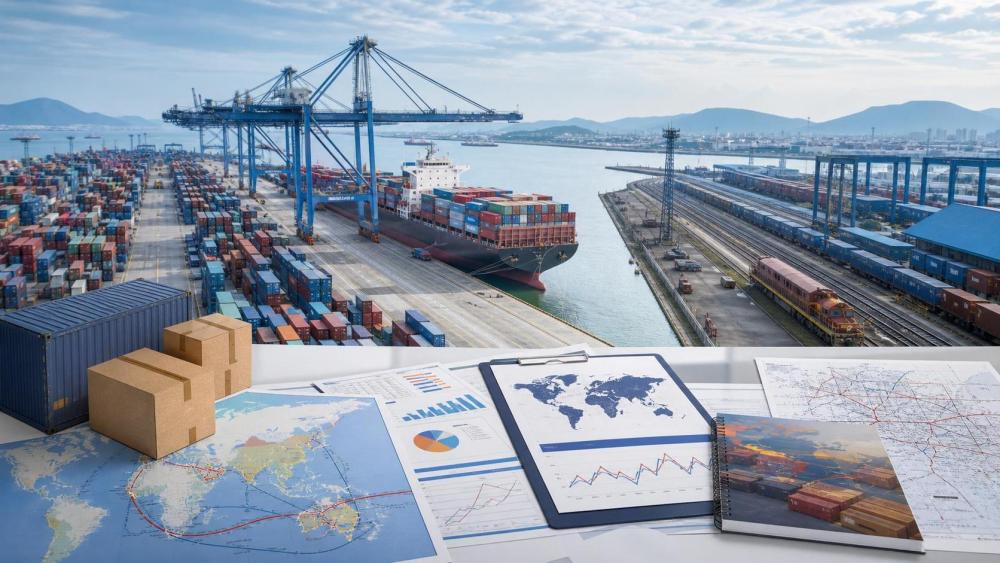
At its core, trade route risk analysis is a decision framework for comparing route resilience. It asks whether cargo can move predictably from origin to destination under normal pressure and under stress.
That includes physical movement, but it also includes administrative and regulatory flow. A route is only as reliable as its weakest handoff point.
For bulk commodities, heavy equipment, industrial inputs, consumer goods, and specialized components, the risk profile differs. Still, the evaluation logic stays consistent.
- Transit stability across ocean, rail, air, or multimodal links
- Port and terminal congestion patterns
- Customs clearance variability and inspection intensity
- Geopolitical exposure, sanctions, or regional conflict spillover
- Carrier reliability, schedule integrity, and rerouting probability
- Documentation and compliance friction by corridor
A useful trade route risk analysis therefore compares not just speed, but the probability of disruption across the full shipping chain.
Why safer route comparison has become more urgent
Cross-border supply chains have become more interconnected and more brittle at the same time. One issue at a canal, border crossing, export checkpoint, or regional hub can ripple across multiple industries.
The problem is not only dramatic disruption. More often, risk accumulates through small failures: recurring customs holds, equipment shortages, missed vessel windows, or policy changes that add hidden dwell time.
This is where a structured trade route risk analysis becomes valuable. It converts scattered market signals into a route comparison that can support planning, sourcing, and supplier commitments.
GTIIN’s research model is relevant here because route safety cannot be judged from freight data alone. It requires trade intelligence, sector context, export trend monitoring, and a supply chain resilience lens.
When industrial buyers assess sourcing corridors across Asia, Europe, the Middle East, or the Americas, they increasingly need a view that connects macro events with shipment-level consequences.
The main risk dimensions behind route selection
Not all risks deserve the same weight. A route for low-value replenishment cargo can tolerate more delay than one carrying regulated inputs or production-critical parts.
Geopolitical and policy exposure
Trade lanes crossing contested waters, sanction-sensitive jurisdictions, or politically unstable transit zones demand close review. Risks include detours, insurance increases, cargo screening, and abrupt policy restrictions.
Infrastructure and congestion risk
A route may look efficient on paper but perform poorly if ports face berth shortages, labor interruptions, or weak inland connections. Congestion often damages schedule reliability long before it changes headline transit time.
Customs and documentation complexity
Different corridors create different clearance burdens. Product classification disputes, origin verification, dual-use controls, or changing environmental rules can slow release and raise compliance risk.
Transport reliability and cargo suitability
Carrier performance matters, but so does cargo fit. Heavy machinery, sensitive electronics, temperature-controlled goods, and bulk materials each respond differently to transshipment frequency and handling conditions.
How to compare safer options in practice
A good trade route risk analysis does not stop at naming hazards. It ranks alternatives using comparable criteria and realistic operating assumptions.
One practical method is to score each route across a small set of weighted indicators. That keeps discussion grounded when price pressure favors a route with weak resilience.
Build a route scorecard
- Average transit time and variance, not only best-case timing
- Port throughput stability over recent quarters
- Customs release predictability by product category
- Exposure to sanctions, export controls, or tariff shifts
- Availability of backup carriers or alternate nodes
- Cargo damage risk tied to handling intensity
Test the route under stress
The safer option is not always the route with the highest normal-speed score. It is often the one that degrades more slowly during disruption.
That means asking what happens if one port closes for five days, if inspection rates rise, or if a feeder connection is removed. Routes with fallback capacity usually outperform cheaper but rigid options.
GTIIN’s full-dimensional mapping approach is useful because it links micro indicators, such as customs latency and carrier cycles, with broader industrial and geopolitical trends.
Where route risk differs by industry situation
The same lane can be acceptable for one shipment profile and unsuitable for another. Trade route risk analysis works best when matched to cargo value, regulatory sensitivity, and replenishment strategy.
Production-critical components
For inputs tied to line continuity, delay risk usually outweighs small freight savings. Routes with strong schedule integrity and low customs volatility tend to be safer options.
Bulk and heavy industrial cargo
These shipments depend heavily on terminal capability, inland transfer capacity, and physical handling constraints. Congestion and infrastructure mismatch can cause larger setbacks than border procedures.
Regulated or sustainability-sensitive goods
Where CBAM, ESG reporting, origin rules, or technical conformity standards apply, compliance path matters as much as transport path. A route with cleaner documentation flow can reduce both delay and audit exposure.
This is one reason general freight benchmarks are not enough. Cross-sector comparison must be adjusted for product structure and regulatory burden.
Signals that deserve closer monitoring
Route conditions change gradually, then suddenly. Safer route selection depends on watching early signals before they become shipment failures.
- Freight rates diverging sharply from historical corridor norms
- Persistent vessel delays at one transshipment hub
- New export licensing checks for strategic materials
- Rising customs query frequency on origin documentation
- Political events affecting border policy or marine security
- Carrier schedule changes that remove redundancy
A disciplined trade route risk analysis treats these signals as decision inputs, not background noise. That is especially relevant when contracts, inventory buffers, and supplier commitments depend on stable delivery performance.
Turning analysis into a better next decision
The most useful outcome is not a perfect route. It is a route choice that is explicit about tradeoffs, backed by current intelligence, and resilient enough for the shipment’s real business role.
A concise trade route risk analysis should therefore end with a practical comparison: which route is cheapest, which is fastest, which is most stable, and which remains workable if conditions worsen.
From there, the next step is straightforward. Review the route scorecard, challenge assumptions about lead time and compliance, and track the corridor signals most likely to change the decision.
For organizations operating across volatile markets, the safer option is usually the one chosen with better evidence. That is where ongoing trade intelligence, sector-specific route monitoring, and structured comparison create measurable value.
Weekly Insights
Stay ahead with our curated technology reports delivered every Monday.
Recommended News
 Supply ChainOct 15, 2026How to choose a supply chain strategy for unpredictable demand
 Supply ChainOct 14, 2026How to assess an industrial equipment supplier's spare parts support
 Supply ChainOct 14, 2026EU Updates CSDDD Guidance on Global Supply Chain Due Diligence
 Global SourcingOct 13, 2026How to assess industrial automation suppliers for legacy integration