Which supply chain intelligence metrics help detect supplier risk?
Supplier risk is easiest to detect when delivery, capacity, quality and financial signals are assessed together. A supplier can still meet every confirmed delivery date while extending lead times, consuming its available capacity or relying on emergency freight. Those changes may indicate weakening resilience before a missed shipment appears in the scorecard.
The most useful supply chain intelligence metrics therefore combine current performance with early warning indicators and exposure measures. Their value depends on the decision they support: expediting a critical order, investigating a production constraint, qualifying another source or increasing inventory coverage.
Start with delivery performance, but look beyond the headline rate
On-time delivery (OTD) is a practical starting point: divide the number of order lines delivered on or before the agreed date by the total number of order lines due in the period. For risk monitoring, calculate it against both the original requested or contractually agreed date and the latest confirmed date, where those dates are available.
That distinction matters because repeated date changes can conceal deterioration. A supplier may show strong performance against revised commitments while the buyer receives material later than originally planned. Record who requested each change and why; a delay caused by a buyer’s specification change should not be treated as supplier failure.
Lead-time variability adds a forward-looking dimension. Track the time between order placement and receipt, then compare recent results with the supplier’s historical range and the planning lead time used in the purchasing system. A widening spread makes inventory planning less reliable even when the average remains stable.
Segment these measures by part, site and transport route. An aggregate supplier score can hide a serious issue at the plant producing a critical component. For infrequently purchased items, a few late orders can distort percentages, so review the individual orders as well as the rate.
Other useful delivery signals include:
- Past-due backlog: the value or quantity of open orders past their agreed delivery dates. A rising backlog indicates accumulated exposure rather than a single late shipment.
- Order-confirmation time: the time between purchase order issuance and supplier confirmation. Longer confirmation times can signal uncertainty about materials, capacity or scheduling.
- Expedited shipment frequency: the share of shipments requiring unplanned premium transport. Stable delivery performance supported by repeated expediting may be costly and fragile.
These measures need consistent definitions. Agree whether delivery means arrival at the buyer’s site, handover to a carrier or another contractual milestone. Also separate supplier-controlled delays from customs holds, buyer-requested postponements and transport disruptions when the data permits.
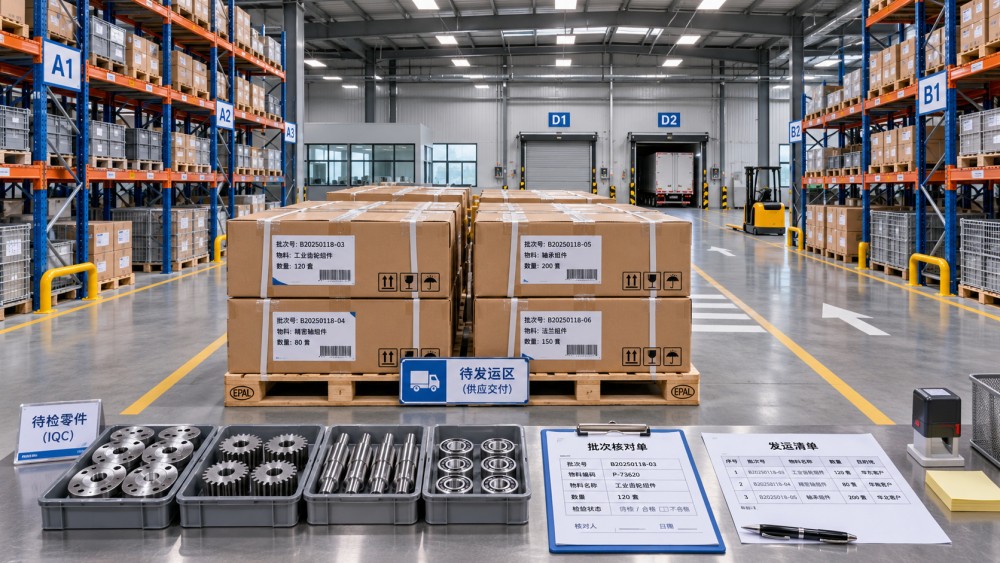
Measure the capacity behind the delivery promise
Delivery history says what has happened; capacity indicators help assess whether the next demand change can be absorbed. For constrained or highly customized products, ask for available capacity at the relevant production line or process, not just total factory capacity.
Capacity utilization is production output divided by practical available capacity over the same period. Its interpretation depends on the process: a plant with flexible staffing and short changeovers has a different risk profile from one dependent on a single furnace, tool or qualified operator. Utilization figures supplied by a vendor should therefore be accompanied by their assumptions about shifts, maintenance and the product mix.
Compare committed capacity with forecast demand, including reasonable upside scenarios. A supplier that can satisfy the current purchase order but has no room for a demand increase may become a bottleneck. An actionable follow-up is to request a capacity reservation, confirm subcontracting arrangements or qualify another production site.
Recovery time and inventory coverage connect supplier constraints to the buyer’s own exposure. Estimate how long it would take to restore supply after a disruption and compare that period with usable inventory coverage: available stock, adjusted for quality holds and committed demand, divided by expected consumption over the same time unit. If coverage is shorter than recovery time, there is an uncovered interruption window. The estimate should state whether recovery assumes repairs, a substitute supplier or a new qualification.
Use quality trends to identify unstable processes
A shipment that arrives on time but cannot be used does not protect production. Track incoming defect rate using a consistent denominator, such as rejected units divided by units inspected, or defects per million opportunities where that measure is appropriate. Pair it with the number of units inspected: a defect rate based on a small sample provides limited evidence about the wider shipment.
Also monitor the rate of lots rejected or placed on hold, repeat nonconformities and the time required to close corrective actions. An individual defect may be contained quickly; recurring defects or overdue corrective actions can indicate that the underlying process problem remains unresolved.
Quality data needs context. A higher reported defect rate can result from tighter inspection, a changed specification or a different product mix rather than declining supplier performance. Record these changes alongside the trend. Where material is safety-critical or subject to qualification, the severity of a defect may matter more than its frequency.
A useful escalation combines signals: rising defects, longer lead times and a growing backlog warrant a closer review of production controls and capacity. A single isolated quality event may instead call for containment and verification of the corrective action.
Assess financial pressure without treating one ratio as a verdict
Financial deterioration can affect a supplier’s ability to buy inputs, maintain equipment or retain staff. Useful indicators include liquidity measures, debt obligations, profitability trends and, where reliable information is available, payment delays to the supplier’s own vendors.
Current ratio—current assets divided by current liabilities—offers a basic view of short-term liquidity. Operating cash flow provides a different perspective: accounting profit does not necessarily mean cash is available to fund operations. Credit-rating changes, public filings and verified legal notices can add context, but their coverage varies by company and jurisdiction.
Compare financial information over time and against an appropriate business context rather than imposing one universal cutoff. A distributor holding substantial inventory has a different balance-sheet structure from a service provider. For private suppliers, audited statements may be unavailable or infrequent; supplier-provided information should be distinguished from independently verified data.
Financial concern should lead to proportionate inquiry, not an automatic sourcing decision. Confirm whether the relevant legal entity and production site are affected, assess open-order and tooling exposure, and discuss continuity arrangements. Avoid assuming that a strong parent company will support a subsidiary unless that support is documented.
Map concentration to the actual source of disruption
Spend concentration is the share of category or part spend placed with one supplier. It is easy to calculate, but it does not by itself establish disruption risk. A low-spend component can stop a production line if no approved replacement exists, while a high-spend commodity may have several qualified sources.
More revealing measures include:
- Single-source exposure: the number or share of critical parts with only one approved source.
- Site concentration: the share of critical supply produced at one facility, regardless of how many supplier names appear on purchase orders.
- Geographic and route concentration: the share of volume dependent on a particular region, port, border crossing or transport corridor.
- Sub-tier dependency: critical inputs, tooling or processes shared by apparently independent direct suppliers.
Two suppliers do not constitute effective diversification if they depend on the same upstream plant or logistics route. Conversely, two production sites in the same country may still reduce facility-specific risk, even though they remain exposed to a common national disruption. Map the dependency at the level relevant to the decision.
Complete sub-tier visibility is difficult. Mark unknown locations and dependencies explicitly rather than treating them as diversified. A practical measure is the percentage of critical parts for which the manufacturing site and key upstream dependencies have been confirmed. Low visibility is not proof of disruption, but it limits confidence in the risk assessment.
Turn signals into an actionable supplier-risk view
A scorecard is most useful when it separates likelihood signals from business impact. Delivery deterioration or a negative financial development may increase concern about interruption; lack of an approved alternative and limited stock coverage determine how damaging that interruption could be. Combining everything into one unqualified score can obscure this distinction.
For example, consider an illustrative supplier whose on-time delivery remains acceptable, but whose quoted lead time has increased, backlog is growing and a critical part comes from one plant. The appropriate response is not necessarily to replace the supplier immediately. Confirm the cause and expected duration, reconcile the backlog with production plans, and calculate coverage against the recovery time. If the resulting gap is material, investigate inventory protection and an alternative source while monitoring whether the supplier’s recovery plan is being met.
Set alerts against the supplier’s own history, contractual requirements and the criticality of the material. A deviation that warrants immediate review for a sole-source component may be less urgent for a readily substitutable item. Use both a threshold and a trend where possible: an indicator may remain within its limit while deteriorating steadily.
Every alert should have an owner, a review date and a specified response. A practical record includes the affected part and site, the evidence and its date, potential operational impact, actions agreed with the supplier, and the condition for closing or escalating the issue. This prevents dashboards from becoming collections of unresolved red flags.
Keep the data credible enough to support action
Risk metrics lose value when records are stale or definitions change. Reconcile purchase orders, promised dates and receipts across systems; remove duplicate transactions; and retain original commitments when dates are revised. Financial information, factory capacity and sub-tier locations need their own update schedules because they do not change or become available at the same frequency as delivery transactions.
Record the source, observation date and confidence level for consequential indicators. A supplier-confirmed production location, a public filing and an unverified media report should not carry the same evidentiary weight. Where data is missing, flag the gap rather than assigning a reassuring score.
The strongest early warning is not necessarily the most complex metric. It is a credible change in a measure tied to a real dependency, reviewed early enough to protect supply. Pairing that signal with a clear response makes supplier intelligence useful before a disruption reaches the production schedule.
Have questions about this sector analysis, or seeking best practices specific to your niche? Drop us a line below and let the senior consultants at GTIIN assist you.
“We respect your privacy. Your information is strictly confidential.”
Weekly Insights
Stay ahead with our curated technology reports delivered every Monday.
Recommended News
 Supply ChainNov 07, 2026EU Opens Safeguard Investigation into PET Resin Imports
 Industry StandardsNov 07, 2026Which ISO quality management standard can a company be certified to?
 Supply ChainNov 06, 2026How to use a supply chain risk analysis model to prioritize suppliers
 Supply ChainNov 06, 2026Drewry WCI Falls 1% to $4,389 per 40-Foot Container